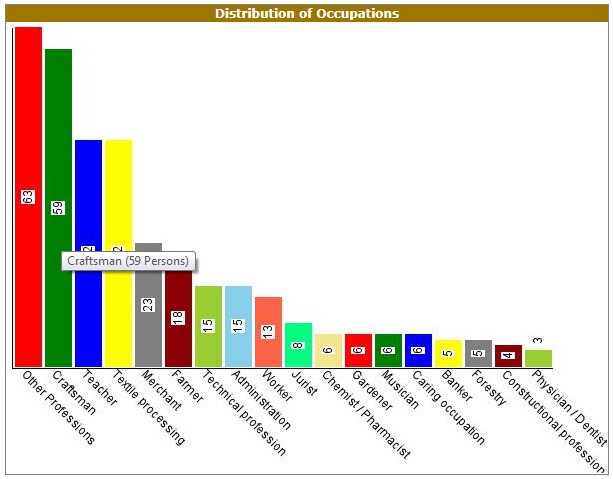
The occupation overview displays the numerical distribution of
individuals in different occupational groups as a bar chart.
If you move the mouse pointer over the bars of this graph, a short message
appears on the current occupational group::

In this example, you can see that there are 59 craftsmen in the family gallery.
If you click on one of these bars, another page is shown where you can see
detailed information about this
occupational group.